Event Review: Coalesce 2022
- Monica Kay Royal

- Oct 19, 2022
- 18 min read
Updated: Oct 21, 2022
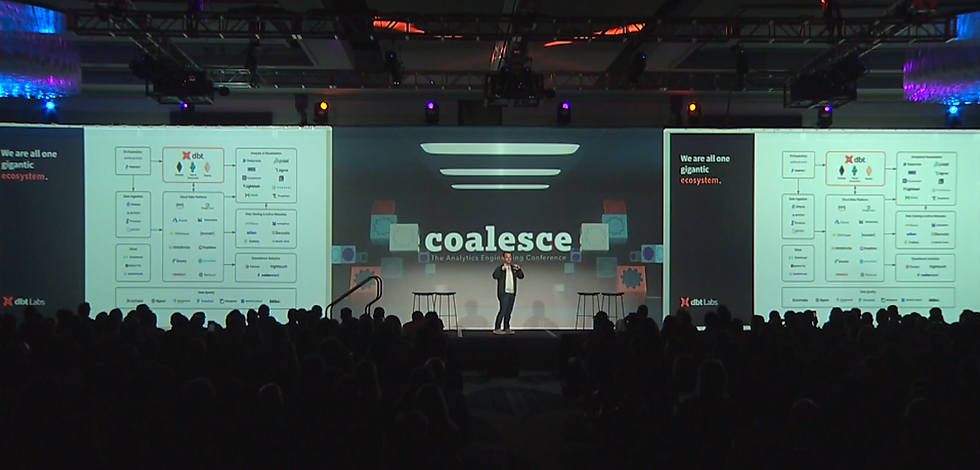
The 3rd annual analytics engineering conference with live and remote options to accommodate attendees in all time zones. Join dbt Labs and thousands of data humans like you to rethink how the world does data.
This conference was held in New Orleans, London, Sidney, and virtually online. TBH, I got a bit of FOMO when I saw some of my LinkedIn community posting pictures from New Orleans. What a great place to hold a conference!
Day 1
Jillian Corkin, Curator of Community Stories and Amplifier of Voices, kicked off the event in a DND Dungeon Master fashion, with the theme of purple! “As we gather across the globe, let us coalesce around this campfire of purple flames sharing stories about the database dragons we slayed, the stakes we are beholden to, the insights we've uncovered, and the lessons we wish to share.”
I typically attend events that are jam packed full of amazing sessions, but this one took it to a whole ‘nother level!! I couldn’t even try to attend every session because there were always about 3+ sessions going on at the same time. They were all recorded for later viewing, but I would be here for days trying to view them all, which is a bummer! This just required me to carefully select the sessions that I thought were the most valuable to myself and y’all to recap. Here are my favorite sessions, enjoy! 🤓
Data - The Musical
Senior Director, Product Data Governance @ Adidas
The off-Broadway, on-Bourbon adaption of "Data—The Musical."
This is probably the BEST way to kick off an event, hands down. If you like musicals and data, go check out Tiankai’s YouTube, he has tremendous talent and is super creative at making data fun!
He also gave some tips on how/why to get started in music:
Start singing in the shower
Loud singing is good for the immune system
If you really like a particular instrument, just try it out
What does analytics engineering have to do with product experimentation?
Sr. Analytics Engineer @ Netlify
Adam asks that you at least take away these two points from this session:
You can create impact by driving product experimentation (great for your employer)
Driving experimentation is great for leveling up your skills and influence (great for your career)
First off, what is an experiment?
Typical experiments in data include A/B Testing, Randomized Controlled Trials (RCT), and Multivariate Tests (MVT).
Driving experimentation is difficult, although the process itself is relatively simple. You take a set of users, split them in different groups, each group experiences something different, then you measure metrics for each group and hopefully there is a significant difference which brings value. But oftentimes, we find that we suck at assessing the value of our ideas.
80% of the time we are wrong about what a customer wants ~ Google
90% of what we try is wrong ~ Netflix
We can only [correctly] guess 33% of the time ~ QuickenLoans
Aside from these facts, experimentation is valuable. In fact, Adam shared that experimentation is a defense against annoying metric questions. If leadership is looking at a high level metric and notices a dip in conversions, they might blame it on a new feature release. Good thing for experimentation is that the feature was tested and shown that it was valuable. Therefore, the dip was due to something else.
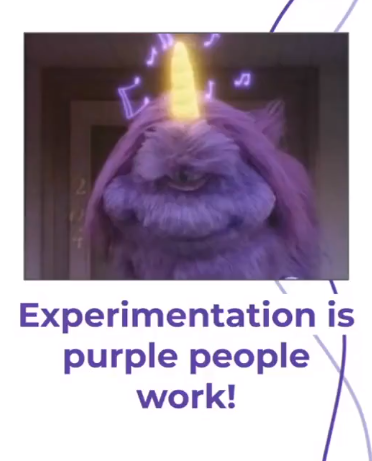
My favorite part about this session was the callout to purple people. Anna Filippova wrote a wonderful article describing the work of purple people. In summary, they are the generalists who can navigate both the business context and the modern data stack.
In conclusion, professional development is part of your job and you are paid to do it.
Professional Development Resources:
SQL: The video game
Analytics Engineer / Game Developer @ Cedar Cat Studios
I attended this session as I was curious what other SQL games people are creating out there. I am currently working on my own inspired by the SQL Murder Mystery, which I reviewed here. It will be a remix which incorporates the Marvel Comic Universe! 🦸♀️
Joseph used Unity and BigQuery to build out his SQL Game. The unity game engine handles user interactions and core gameplay mechanics while BigQuery handles the API. He found that data analytics and game dev pair very well together (I agree!) and utilizing community forums helped to get insight from others.
If you want to check out Joseph’s game, visit his GitHub
Escape from Data Island - Orchestrate and Connect Your Data Stack for Smooth Sailing
Sponsored By: Shipyard
Co-Founder & CEO @ Shipyard
Data Community Advocate @ Shipyard
This session was eye opening, made me a little dizzy, and definitely gave me some not so great flashbacks. As weird as this sounds, it was one of my favorite sessions!
Blake started us off by introducing us to Data Island
Welcome to Data Island. Worst rated place on the planet. Easy to get onto, but difficult to get off.
Not sure if you are on a data island? Here are four signs:
Every tool runs independently
No clue how data gets used
Fires break out regularly
No one trusts the data
Blake then walked us through the typical data journey >>
You have these email campaigns that you want to measure to see how they are doing, so you ingest the data and try to find it a home. This data is way too big for a typical data storage solution so it needs to be transformed. Then you are ready to perform data analysis, but it doesn’t stop there. You need to figure out how to present the data to users so you decide on data visualization. Some people don’t like charts and want a report, so now you have to figure out how to create a report. New data source incoming! You now have survey data and the cycle restarts... This is where I started getting dizzy 😵
With the model that was presented, there were 19 points of failure, 12 unique processes, 4 team divisions, and now you have data teams focusing more on “RequestOps” than DataOps
And this is only if things run smoothly… This is where the flashbacks began 🥴
Without proper testing or alerting in place, it is easy to start collecting bad data without even realizing it. BUT, the good news is that bad data can actually help you!
Presenting The Escape Plan:
Data Orchestration
Awareness: trace data from source to destination
Implementation: connect touchpoints from A > Z
Enforcement New Request? New Connection.
Modern Data Orchestration
Enables rapid experimentation
Observability for every data touchpoint
Minimizes potential for errors
⭐ Ideal State
Anyone on your team can set up data workflows
Everything is connected
Every data workflow is tracked and visible
Business users trust their data
Data teams can drive more value
Empathy-building in data work
Associate Director, Business Analytics @ Wonder
Some of us are told to go to work like Stormtroopers. All in line, in uniform, with a primary focus on getting work done.
However, we are really all just the cast from Pixar’s computer-animated film ‘Inside Out’...
We have emotions!
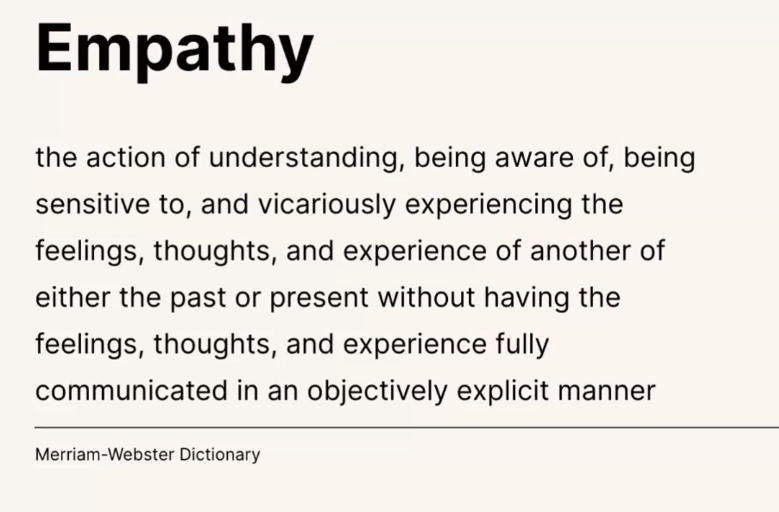
What is empathy?
First, let’s start with the formal definition, so everyone starts with a common knowledge.
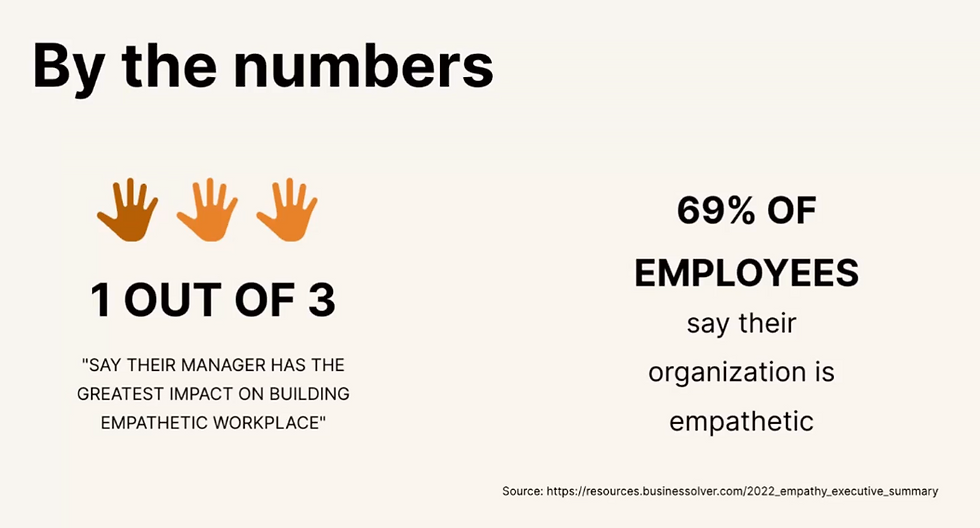
How can empathy help us do better at work?
With your team:
Be aware, are people having an off day or has there been a recent change in behavior
Hold 1:1 meetings, not everyone is open to sharing with a larger team
Create space, make time to talk about your life
With your stakeholders:
Get to know them. What has been their experience with data? Are they carrying any data scars?
Awareness. Understand if someone is going through a hard time. Always ask how they are doing.
Think beyond just building dashboards and analysis. Find out what keeps them up at night.
With your manager:
They are people too
Have boundaries, know that they can't tell you everything
Speak up, create that space or ask for the space in your team to have more open conversations
In hiring:
Listen to issues or concerns that a candidate may have
Don't make assumptions around gaps in their employment
How did they treat your team during the process? Build out your zero tolerance list.
Joel Labes shared in the Slack channel, LinkedIn lets you add career breaks to your timeline
Day 2
This seemed like the first real day of the conference as the morning Keynote was presented by Tristan Handy, Founder & CEO dbt Labs
Coalesce 2022 Attendees
96 countries represented
20% Analytics Engineers
70% dbt Slack users joined
And, FUN FACT: there are 50K humans in the dbt Community!

To be successful in this competition, we need to:
Make it easy to create a new piece of knowledge
Establish trust in this knowledge
Enable the social governance of this knowledge
Make this knowledge widely accessible
We are all one gigantic ecosystem ~dbt Labs
Legends of the Hidden Table
Sponsored By: Hex
Two teams of three data analysts compete in a series of challenges in this ultimate showdown. A game show about bravery, comedy, and head to head data challenges.
Who will reign supreme?
As a Millennial, I particularly enjoyed this fun session, a callback to a gameshow that was near and dear to my heart. The 2016 Nickelodeon movie remake wasn’t too bad either. But someone please tell me WHY was the monkey puzzle so hard to put together!! 🙈
Teams:
Purple Pythons
Pink Pandas
Challenges:
Quick Question: Can you pull the numbers for revenue by city?
P0: This dashboard looks wrong
OKRs are due this week, can you use some data science to set our revenue targets?

Some fun callouts from the chat that made me chuckle:
use more 'machine intelligence'
data science only exists in san francisco
No one finish! Gotta keep development time expectations reasonable
Next year the gameshow I want to see is "Whose Metric is it Anyway". "Where the dimensions are made up and the numbers don't matter"
“The easy way” to launch analytics at a startup with dbt
Director of Data and Analytics @ Maple
VP, Business Technology @ Maple
Analytics at a startup….something that might scare most data folks. But not Lindsay Murphy of Maple! Join Lindsay as she draws on her experiences to demystify and template the process behind using dbt to create robust self-service analytics practices at startups and other small companies.
Key Takeaways for Startups trying to launch analytics:
Getting buy-in to purchase software by finding cost saving opportunities and keeping an accomplishments log
Teaching others to fish (self-serve) by utilizing curation and leveraging “champions”
Startups follow a common pattern of early data needs
dbt will help you increase impact as a “team of one”
Anticipate common challenges
Data-led is dumb
Data Strategist in Residence at Amplify Partners
More and more companies are raising the “data-led” banner as manifest operational excellence. But is it true? Who's leading who? In her talk, long-time Coalesce dynamo, Emilie Schario (Amplify Partners) challenges data teams to start treating data like a product not a prophet—no better or worse than the people and processes it represents.
Thank you to Emilie for a refreshing perspective on the topic of companies being data-led.
In traditional fashion, let’s start out with defininting what it even means to be ‘data-led’
A data-led company is “run by data products, infrastructure, and services. The key business need is the ‘productionalization’ of data services that unlock Product and Data Science teams, allowing them to automate operational decision-making and user product experiences.” ~ Crystal Widjaja, Reforge blog
But do we even want to be data-led?
We want data to drive impact but we can’t and shouldn’t expect data to have all the answers.
Why is data-led dumb?
Data is only as good as it’s instrumented
Data lives within a context
Data is never the end-all, be-all
Say you are trying to answer the question ‘How many customers do we have?’
Customers are defined differently at different organizations and is even defined differently within the same organization across different departments
If you optimize for what you think you are trying to answer, you lose the big picture
We cannot expect data to be perfect because people are producing data, and people are not perfect either!
The framework for scaling data:
We can’t just be number fetchers for others (Service model)
We can’t just be number fetchers of the right numbers (Product model)
We HAVE to make sure our numbers have impact (Operations model)
BUT, it’s not enough to find interesting insights if we don’t also make sure those insights drive change. We need to focus on operationalizing the work we are doing which is best enabled through data business partnerships.
Data partnerships are about data being a key part of the workflow, not an afterthought. So, when data teams work as an operations team, insights drive impact.
To reiterate, in conclusion: data-led is dumb
"But my number says this"...and other horror stories
Sponsored By: Mode Analytics
VP, Marketing @ Mode
Building consistent, trustworthy data sets may start with analysts, but to make it work, we have to bring others to the table. I’ll share a business person’s take on how rethinking BI will help get trusted data to every corner of your organization – and eliminate those “my number says this…” conversations. I’ll show what Mode’s been working on to bring metrics to life for both data teams and business teams since Benn’s fateful blog post last year. Spoiler alert: it starts outside the tools by bringing teams closer together, crafting common language, and moving at the speed of business today.
One big concept from this session that I wanted to highlight was Collective Intelligence. This is how computers and humans can work together as a superorganism to get things done.
It includes combining groups of experts, knowledge & data, and software/hardware. But in order to do this, we all have to be on the same page and talking the same language.
Once this happens, you create an environment based on psychological safety, dependability, structure & clarity, meaning, and impact.
Mode has a great template that covers questions to ask when crafting metrics.
You can grab it here
Three key takeaways from this session:
Leverage Collective Intelligence
Slow down to go fast
Don’t fear iteration
The accidental analytics engineer
data scientist, open source @ RStudio, PBC
Michael talks about how he fell into the wild world of analytics engineering and mentions that data scientists learn about analytics engineering by getting too close to the black hole.
He sees that there are two main cultures:
tidyverse worldview
modern data stack worldview
with analytics engineering being the gap
His advice on how to fill that gap:
Learning dbt
Understanding data modeling
Tracking data in, data out
He also shares some good resources here which I want to share with others.
Inspiration for his talk:
The UX Team of One by Leah Buley
Project Management for the Unofficial Project Manager by Kory Kogon, Suzette Blakemore, James Wood
Tidyverse:
R for Data Science by Hadley Wickham & Garrett Grolemund
Learning dbt:
Cloud: dbt getting started docs
Local: GitHub
Excel at nothing: How to be an effective generalist
Data Engineer @ Whatnot
I have to admit that excelling at nothing sounds intriguing, but I was super excited to attend this session because I consider myself to be a generalist and wanted to learn how to be the most effective at it.
Stephen starts off by sharing the many hats he has worn over the years, and how it has driven him not to trust titles anymore. Why? The work is all mostly the same.
One of Stephen’s first roles was as a Scientist, and in Science school they teach you that if you find something that you like, declare to the world that you like it but that it is wrong and you can do it better!
He goes on to expand on the purple people and talk about all the possibilities.
As mentioned in a prior session, purple people are the generalists who can navigate both the business context and the modern data stack. Anna Filippova wrote a wonderful article describing the work of purple people.
This would make you think that generalists are an intersection of a Venn diagram, but there really isn’t a center. There are actually a bunch of smaller communities and areas of focus. This crazy picture shows the true complexity of how generalists actually work.

You might notice that this is related more to Stephen’s work as a Scientist, so why is he talking to data folks about this? Well, because it is totally relatable. Data work is generalist work, between community interfaces.
To look at this from another perspective:
Organizations comprise communities
Communities emerge from relationships
Relationships are individuals working together
… and the generalist mostly operates between communities, bringing them together
As great as this all sounds, purple people (generalists) have people problems 😟
They don’t have a home because they straddle communities
Mitigation: Optimize for the community, and satisfy the other
They can’t get adoption because the best tool for the job is a tool neither community uses yet
Mitigation: Do not try to innovate
If they are successful, this creates unwanted and unsustainable maintenance work
Mitigation: Identify long-term owners early, and don’t be afraid to let go!
or as Stephen better put it...
generalists should be ok with letting things burn 🔥
People who stand near the holes in a social structure are at higher risk of having good ideas ~Ronald Burt, 2004, Structural Holes and Good Ideas
In conclusion,
To avoid pitfalls, excel at no (one) thing
To flourish, excel at (filling) nothing
Day 3
Money, Python, and the Holy Grail: Designing Operational Data Models
Chief Analyst @ Mode
Benn starts us off by talking about the work of Paul Krugman, an American economist who, in 2008, was the sole recipient of the Nobel Memorial Prize in Economic Sciences for his work on international trade theory. It’s not enough to look at numbers, you have to know how the numbers interact with each other and how the economy works.
How do we model our business the same way Mr. Krugman was modeling the economy?
First, let’s look at the definition of an operational model. Note the keyword ‘relationships’
An operational model is NOT:
A machine learning model
A dbt model
An input to operational applications
Benn walks us through how different businesses make revenue, at a high level.

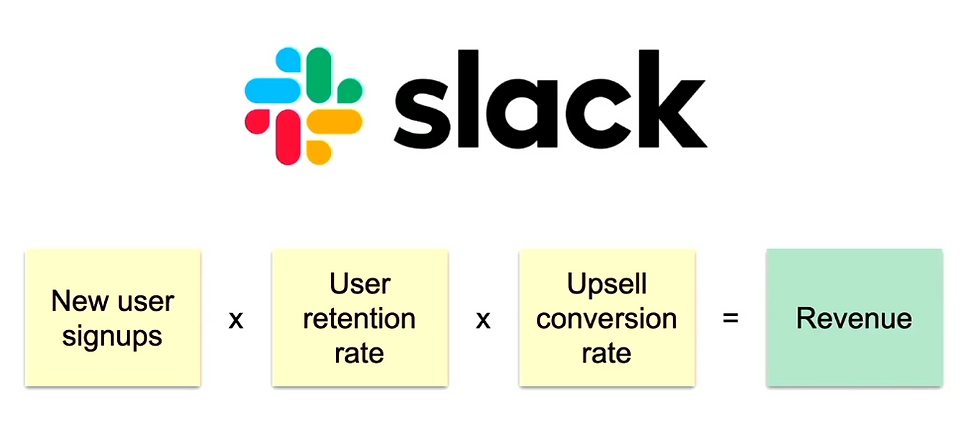
You can think of each of these yellow notes as levers. If you pull on any of these levers, you are going to affect Revenue. Looking at the reverse: if revenue goes up or down, it was due to one of these levers.
This may sound simple, but each of these levers are complex as they each have their own processes. Data teams cannot build these models without understanding the underlying processes, it is a team effort.
In reference to KPIs and metrics, it may be tempting for some businesses to select their metrics by choosing from a list of common metrics such as The A-Z guide to startup metrics: 16 KPIs to help your business succeed. However, that will likely result in metrics that do not even measure the way that your business works.
Therefore, if you start with building out how the business works (like the equations above), you are more equipped to select meaningful KPIs and metrics.
Data teams v. The recession
CEO @ Eppo
Our new economic reality is sending data teams into uncharted territory for justifying tools and technology—especially those with traditionally nebulous ROI. Does this make data teams a cost center? In this talk, Chetan Sharma (Eppo) will share clear steps to calculating ROI by comparing traditional data actions without clear revenue return (bespoke dashboards, ad-hoc data pulls), against things like data-supported product development testing, operations execution, and GTM planning.
I attended this session since it hits home for a lot of folks out there in the data community and thought it would be good to share Chetan’s tips.
Since about May 2022, layoffs were everywhere in tech. Netflix, Robinhood and Snap cut employees while Meta and Amazon implemented hiring freezes.
But why is this happening the most with data teams? Because it is surprisingly hard to justify how we really help the business. Product Engineering creates new products which bring in more customers. Marketing creates campaigns which attract more customers. But it’s not clear exactly how data or data teams attract more customers.
There are three ideas to drive an ROI story:
Core business reporting (but only justifies a small team)
Avoid the trap of people pleasing (people pleasing is always a trap)
Directly drive decisions that affect revenue (there are A LOT of variables to consider and decisions are not always driven by the data)
There is still hope, one of the safest ROI bets for a data team is in Marketing
Huge sums of cash are spent
CAC, LTV, payback are difficult to model
Marketing tools don’t understand your data (and need your help)
Another thing related to Marketing is running experiments. A/B experiments are data team’s money maker! A business can’t afford to NOT run experiments.
Chetan shared some interesting experimentation facts, experimentation is a data platform:
Experimentation is a measurement process
Succeeds/fails by data pipeline integrity
Drives investment in data infrastructure foundations
Takeaway:
Look into your Mmarketing department and see if there is a way you can help with data
The missing link: Design as a daily activity
Principal Analytics Engineer @ HubSpot
I absolutely love analogies!! When you can talk about real life situations and then apply it to a topic that you are trying to learn, chef’s kiss 👩🏻🍳
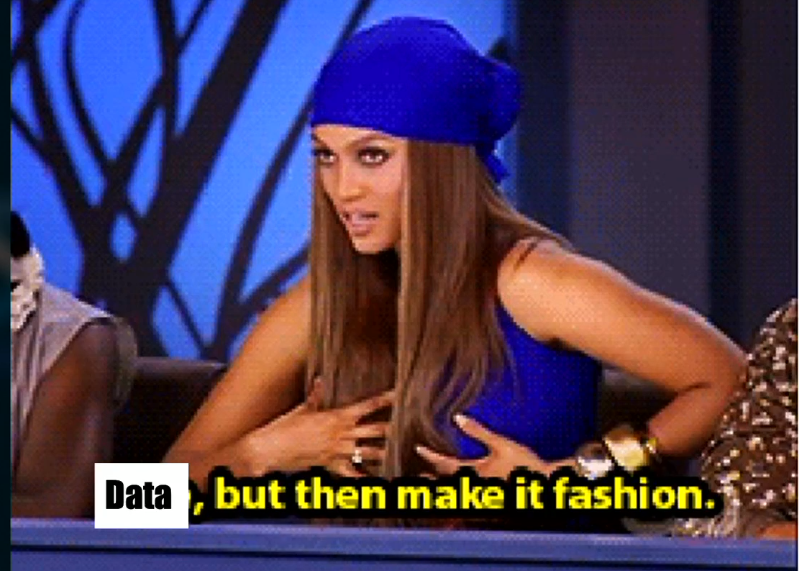
Ashley takes us through how the world of fashion is very much similar to the world of data.
'Next in Fashion' is a Netflix reality show and fashion design competition series hosted by two designers, Tan France and Alexa Chung. These designers team up to create visionary looks that work for everybody.
The show is structured as such:
Prompt
Creative Ideation
Design
Fabrication
Delivery
This may seem very much only related to the show, but let’s look deeper.
In the world of data, a project lifecycle goes something like this:
Business need / user story
Imagining potential user experiences
Designing a process / data solution
Implementing the process / data solution
Users report on effectiveness
This is a 1:1 match! 😄
Ashley shares lessons to be learned from fashion that can be applied to engineering:
Lesson 1: Saying ‘an engineer creates code’ is like saying ‘a designer creates stitches’. Technically correct, but woefully incomplete.
~ code is only part of being technical
Lesson 2: Ideation, design, and fabrication are iterative activities, not steps.
~complex problems need fluid iteraction
Lesson 3: Design can compensate for poor fabrication, but fabrication can’t fix poor design.
~design trumps fabrication
Lesson 4: ‘Analytics Designers’ are the best at tackling complex problems.
~great engineer = great designer
Do analytics teams need product managers?
Sr Manager, Analytics Engineering @ Wellframe
Spoiler alert… Caroline says ‘no’
I have been a product manager in a couple prior roles, and I have to say that a lot of her stories really hit home and I do agree with point of view. There are many times when you feel like a mediator, trying to wrangle all the cats and playing a bad game of telephone.
Another great analogy shared here was with building a restaurant.
Restaurants sell food, you need someone to make food, so you hire chefs.
It takes a lot of work to prepare food, you need someone to take the food to the people, so you hire servers.
But this isn’t quite enough because customers also like drinks with their food, so you hire bartenders.
Bartenders are a bit unique, they are interacting with the customers and preparing consumable items based on their requests, but it would be best that these consumable items were paired with the food to create an overall wonderful dining experience.
Because the bartenders are so busy, you might think that they need a bar (product) manager. However, the bar is the smallest place in the whole restaurant, so it can get crowded fast.
What really needs to happen is that each team needs strong leaders.
Key Takeaways:
Running your team like a product team, doesn’t require a product manager
Company maturity stage matters
Be intentional, not reactive
Day 4
What classes from roleplaying games can teach us about a career in data
Analytics Engineer: Product @ dbt Labs
Roleplaying games? Roleplaying games in data? You read that right. To Ian, there's more commonality in roleplaying games and the data world than most of us think. In this session, Ian Fahey (dbt Labs) will draw on his vast experiences in roleplaying games and analytics engineering work to walk through the adventuring classes of "the world's most popular tabletop roleplaying game" (Dungeons and Dragons) and talk about how they can inform data professionalism.
I got really lucky by picking 3 FANTASTIC presentations in a row, all including fun and relatable analogies. Gold stars to all ⭐⭐⭐
Data Master Ian walked us through all 12 classes of DND 5th edition, which pop culture characters they relate to, what they do, and what they can teach us data people. I am very tempted to share all of his slides here, but I will take only one example from each.
Barbarians: The Hulk - stay raging if they stay fighting - when we’re in the zone on a data problem, we can’t let the small things bother us
Clerics: Steven Universe - protect and heal - address tech debt ‘I cast Cure Wounds and remove all hardcoded numbers from the dbt project’
Druids: Captain Planet - revere and connect to the changeable facets of nature - respect the business ecosystem arounds us in order to harness it
Fighters: pretty much anyone in the DC or MCU - fighters fight - tool proficiency is a power in and of itself
Monks: Neo - well-honed connection with their body to make themselves hard to hit - listen to our body and protect ourselves from burnout
Paladins: Captain America - take an oath to some greater ideal and defend it at all costs - rigor and professional standards are an endless practice and should not be sacrificed without good cause
Rangers: Katniss Everdeen - defend and feel most comfortable on the outskirts of society, where civilization meets the wild - develop our own realms of knowledge and share that knowledge
Rogues: Loki - use their acumen to get into tight spaces and exploit vulnerabilities to do max damage - seek out the data work that has the greatest impact, then strike
Sorcerers: Eleven (‘El’) - natural power is raw and innate rather than learned - never merge code on Friday
Warlocks: Constantine - gain their power by making a pact with a more powerful being - find leadership champions
Wizards: Gandalf the Grey - gain their power through endless study, finding spells through research - learning must be a purposeful career-long endeavor
Bards: Allison Hargreeves - find their magic in speech and song - communicate just as much as we innovate
You can also mix and match!
Monk + Barbarian = Massive work spike
Fighter + Wizard = Is there anything we DON’T know?
Druid + Rogue = Capture broadly, strike deeply
Find combinations, among teams and even within yourself. Combinations result in fired-up stakeholders.

How to not be a terrible writer
Latex Salesman @ Amplify Partners
I am working on my writing daily and appreciate Justin’s secret recipe + spices 😁
Before we get into the secret recipe, why should data people be writing anyway?
Communicate your work effectively to stakeholders
Build your personal brand
Build your team’s brand internally
Recruit great teammates
Documentation
How to write good and do other stuff good too
Good posts are created for a specific people and aim to get them to think or feel a specific thing
Good posts tell a story, they don’t spit facts
Good posts are clearly organized and follow a linear progression of detail
Good posts use diagrams, lists, bold, and italic to convey emotion and break things up visually
Good posts pick the perfect level of depth for the audience and goal
Let’s add the spice 🧂
A piece of content can only be effective for ONE audience - you can’t speak to multiple people at once
Try setting up an example persona up front
Use visual cues to break things up
Write clear section headers, they are more important than you think
You can include fun technical asides, just use parentheses and footnotes
A ‘process’ for emerging from your wordless cave
Write one thing, start small (tweets count)
Find a topic that you care about
Open up a Google Doc and give it a name
Writing an outline will help you avoid writer’s block
When the inspiration hits, get in there
What I take away from this is similar to the Nike slogan… Just do it. ✔

Driving impact with a fine-toothed comb
Data Lead @ Thirty Madison
The reality about analytics engineers is that they have their hands in everything!
Product Management
Engineers
Finance
Strategy
Ops
... and even some actual analytics
But they don’t really fit in anywhere, and that might not be a bad thing!
One last shout-out to the purple people! If you didn’t catch it above, there was an amazing article, written by Anna Filippova describing these purple people (rumor has it they only have one eye, one horn, they fly, and.. they eat people??) 😂
No really, who remembers this song/film? 🙋🏻♀️
🕴🏻 Ok, back to business
Analytics engineers often find themselves caught between a rock and a hard place. They are expected to be both ‘serial generalists’ and domain exports.
Introducing: the fine-toothed comb

All combs are different sizes and the teeth on each are different lengths.
Pretty much everyone has a wide breadth of knowledge: some areas they are experts while others they know just enough to be dangerous. One takeaway here is not to underestimate soft-skills like public speaking and stakeholder management.
Some tips for growing your knowledge:
Ask for help
Leverage your strengths
Don’t stop at data
The only prerequisite is curiosity. At end of day, there will be tons of tools which you will not know, but if you have curiosity and tenacity to learn, you will succeed and drive impact.
__________________________________________________________________________________
AND… that’s a wrap!
I hope that you enjoyed this event and found the recap useful.
Let me know what your favorite session was in the comments 👇🏻
Comments